Note · Weather, water and markets
The canal premium: water, war and the price of passing through Panama
The Panama Canal has two ways of getting expensive. The weather can take away capacity, or the rest of the world can suddenly need more of it. In the last three years we have had a clean example of each, and grain freight shows which one costs more.
The canal runs on rainfall. Every ship that transits uses fresh water from Gatun Lake, and in a dry year the lake drops. When I was in Panama earlier this year, the talk was about a different pressure: trouble in the Middle East pushing traffic toward the canal. I wanted to see how both show up in a price, using public data only.
The Panama Canal Authority publishes daily lake levels back to 1965. USDA publishes the cost of shipping a tonne of grain to Japan from two places: the US Gulf, whose Asia cargo goes through Panama, and the Pacific Northwest, whose cargo does not. Both routes sell into the same buyers and face the same freight market. Divide one by the other and most of the market noise cancels. What is left is roughly the price of the canal. IMF PortWatch adds daily transit counts for Panama, Suez and Hormuz, by ship type.
Water alone is not enough
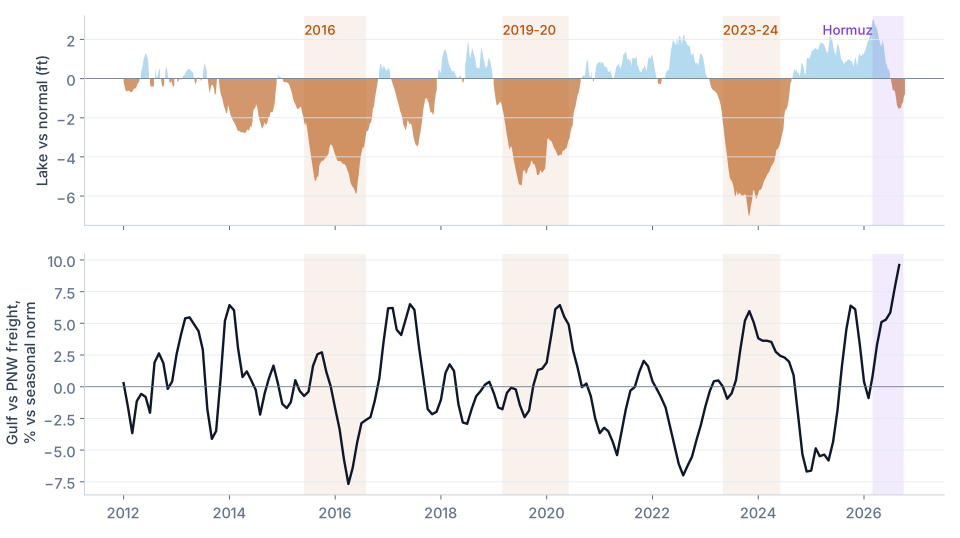
Over the long record, the lake level on its own explains very little. The ratio swings by five percent or more in plenty of years when the lake is fine. The droughts tell a more specific story.
| Episode | Lake low | What the canal did | Gulf/PNW ratio | Change vs prior year | Gulf share of exports |
|---|---|---|---|---|---|
| 2015-16 | -5.7 ft | Draft limits | 1.82 → 1.79 | -1.9% | +0.0 pts |
| 2019-20 | -5.2 ft | Draft limits, then a freshwater fee from February 2020 | 1.81 → 1.84 | +2.0% | +1.8 pts |
| 2023-24 | -6.6 ft | Draft limits, then daily transit caps | 1.76 → 1.87 | +6.0% | -3.7 pts |
Change vs prior year compares the episode average with the twelve months before it, after removing normal seasonal patterns. Gulf share is the Gulf's share of US grain export inspections, seasonally adjusted the same way.
In 2016 and 2019 the canal limited how deep ships could load, and in 2020 it added a fee for fresh water that every ship paid regardless of route. The lake was nearly as low as in 2023. Freight barely noticed. In 2023 the canal went further and capped the number of ships it would pass each day. That is the episode where the Gulf premium rose and the Gulf lost share of US grain exports.
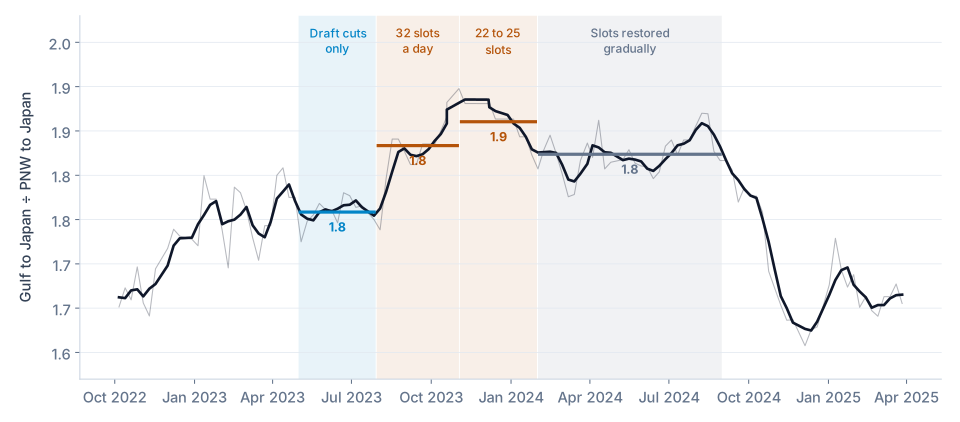
The weekly timing points the same way. The lake was three feet below normal by May 11, 2023. The canal cut maximum draft through May and June, and the ratio sat flat at 1.81. On July 26 it announced a cap of 32 transits a day, starting July 30, and over the following weeks the ratio moved to 1.88. When the cap was tightened to 25 and then 22, it went to 1.91. In 2023 the water and the rationing came together, so the numbers alone cannot fully separate them. The timing suggests the rationing is what the market paid for.
Then the demand side moved
The Red Sea is a useful first test. From early 2024 Suez traffic has run about a third below normal, and a lot of trade that would have gone east went around Africa. If disruption elsewhere were enough on its own, the Gulf premium should have stayed high. It did not. By early 2025 the canal had its capacity back and the ratio was back to about 1.72, below its long-run norm of about 1.81, while the Red Sea was still largely closed.
2026 is different. After the strikes on Iran on February 28, traffic through the Strait of Hormuz fell by more than 90 percent, and Asian buyers turned to the Americas for oil, LPG and LNG. Much of that comes from the US Gulf, and the short way to Asia is through Panama.
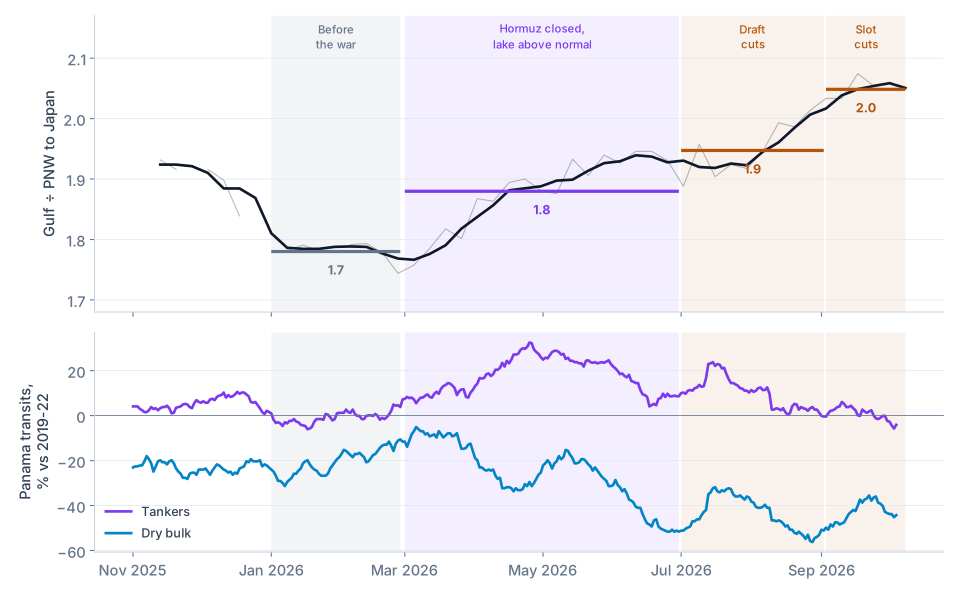
Through March and April the canal was running 38 to 41 transits a day against a plan of 34 to 36, and the premium for an unreserved slot roughly tripled. Tanker transits rose to about 30 percent above normal. Dry bulk went the other way, falling from about 16 percent below normal before the war to about 30 percent below it, and then further. Grain was being outbid for space.
All of this happened with the lake above normal. From March to June the ratio averaged 1.88, up from 1.78 in January and February, roughly the same premium the 2023 drought produced, with no drought at all. Then a strengthening El Niño arrived. The canal began trimming draft in July and cut daily slots from September 3. The ratio went to 1.95 and then 2.05, and one LPG shipper reportedly bid $5.3 million for a single transit.
The premium shows up when capacity binds, from either side. Weather sets how many ships the canal can pass. Geopolitics sets how many want to. Grain, as one of the lower-paying cargoes, is usually the first to be squeezed out.
Putting the pieces together
A simple monthly model for 2019 to 2026, with the lake level, the rationing periods, the Red Sea disruption and the Hormuz crisis side by side, gives a rough sense of size. The Hormuz period adds about 6.5 percent to the Gulf premium (a 95 percent range of about 3 to 10 percent). The Red Sea on its own adds little that can be told apart from zero. The lake and the rationing periods move together too closely to separate cleanly, but together they account for something like 5 percent at the depth of 2023.
For anyone trading or insuring flows through Panama, I think that means watching two things together. On the supply side, the lake and the canal's own forward projection, because they give weeks of warning before slots are cut. On the demand side, anything that sends energy cargoes from the Americas toward Asia, because those ships can outbid nearly everyone else for the same space.
How much weight to put on this
Less than the clean story suggests. A few honest limits:
The samples are small. Rationing has happened twice, and the demand shock once. Monthly data since 2019 gives fewer than a hundred points, and they are not independent of each other.
Other things move this ratio. It reached about 1.9 in late 2025, before the war and with a normal lake, and it spiked in mid-2020. Trade policy, the Mississippi and congestion on either coast all show up in it.
The data is coarse. These are survey rates for one corridor, not traded prices, and the weekly series has a gap in the fall of 2025. Earlier USDA data, before 2009, has obvious errors and I left it out.
Method, briefly
Lake anomaly is the daily Gatun Lake level minus its 1990 to 2019 median for that day of the year. Freight is the Gulf-to-Japan rate divided by the PNW-to-Japan rate, from USDA's monthly series (2009 to 2026) and the weekly Grain Transportation Report text (2020 to 2026). Seasonal adjustment removes each calendar month's average. Transit counts are daily IMF PortWatch estimates, compared with their 2019 to 2022 average. The monthly model regresses the seasonally adjusted log ratio on lake anomaly, indicators for rationing (August 2023 to July 2024, and September 2026 on), Red Sea disruption (Suez traffic more than 15 percent below normal) and the Hormuz crisis (March 2026 on), plus the overall freight level, with Newey-West standard errors. Canal measures and slot prices come from Canal Authority advisories as reported in the trade press.
Data: Gatun Lake daily levels, Panama Canal Authority. Monthly Gulf and PNW to Japan rates and export inspections, USDA AgTransport (rates from O'Neil Commodity Consulting). Weekly rates, USDA Grain Transportation Report. Chokepoint transits, IMF PortWatch.
Canal measures: 2016 draft limit, Maritime Executive. 2020 freshwater surcharge, Dockwalk. 2023 draft cuts, Marine Insight. July 2023 transit cap, GAC. Late 2023 caps, Professional Mariner. 2026 draft cuts, gCaptain. 2026 slot cuts, Supply Chain Dive.
2026 demand: Hormuz timeline, Wikipedia. Transits above plan, Newsroom Panama. Slot premiums, Maritime News. $5.3 million bid, DTN.